

chmonitor v0.3.7 ships 51 new features, 99 fixes, and 16 performance changes since v0.3.6. The agent got smarter, alerts are easier to set up, the sidebar is easier to move around, and the docs have a new look.
What’s new in v0.3.7
A smarter agent
The agent can now read what any dashboard page shows with a new
get_page_data tool, so you can ask about the page in front of you. A tool
catalog with a search_tools tool lets the agent find the right tool
instead of loading every one up front. There is also a read-only PeerDB
metrics tool, and the PeerDB tools return grouped log patterns.
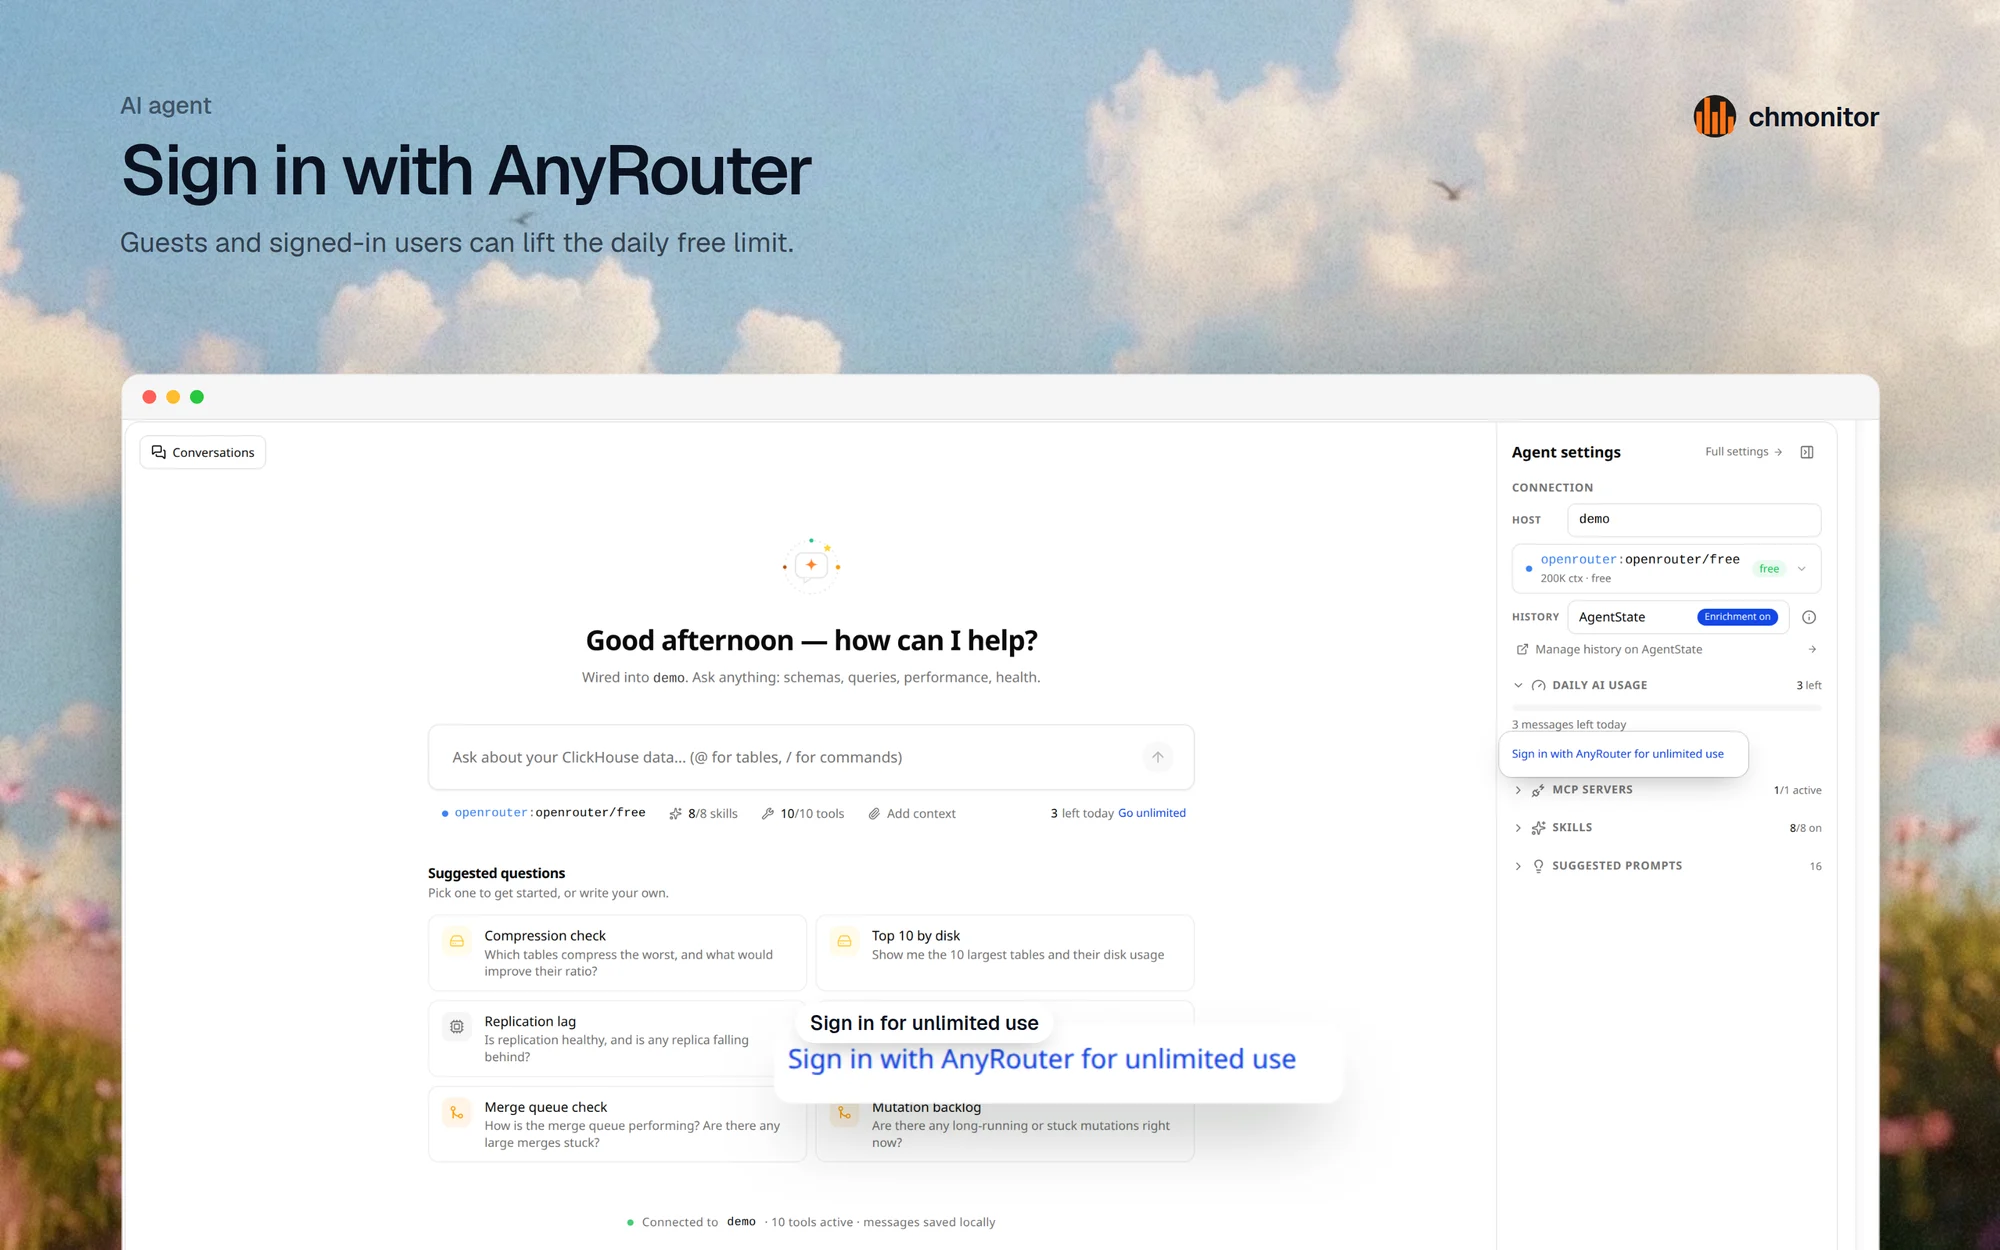
- Sign in with AnyRouter. Guests and signed-in users can sign in with AnyRouter from agent settings (behind a flag). An AnyRouter token is never sent to another provider.
- Your own data. When you are signed in, the agent answers from your own connection, never the demo host.
- Control tools by default. Control tools are on by default for self-hosted and off in Cloud.
- Sensible defaults. The agent picks a model from whichever provider key is set, and you can export conversation history as JSONL.
- Lighter requests. Output tokens and steps are capped, tool results are capped by size, and old tool results are compacted before they go back to the model.
Alerts and health
You can now configure an alert right from a health check’s detail dialog, and the dialog shows whether that check is already alerting. Alerting turns on when a channel is configured, and built-in alerts can be listed and renamed. The Advanced sections of Alert Settings are regrouped by job, and six new built-in rules were added.
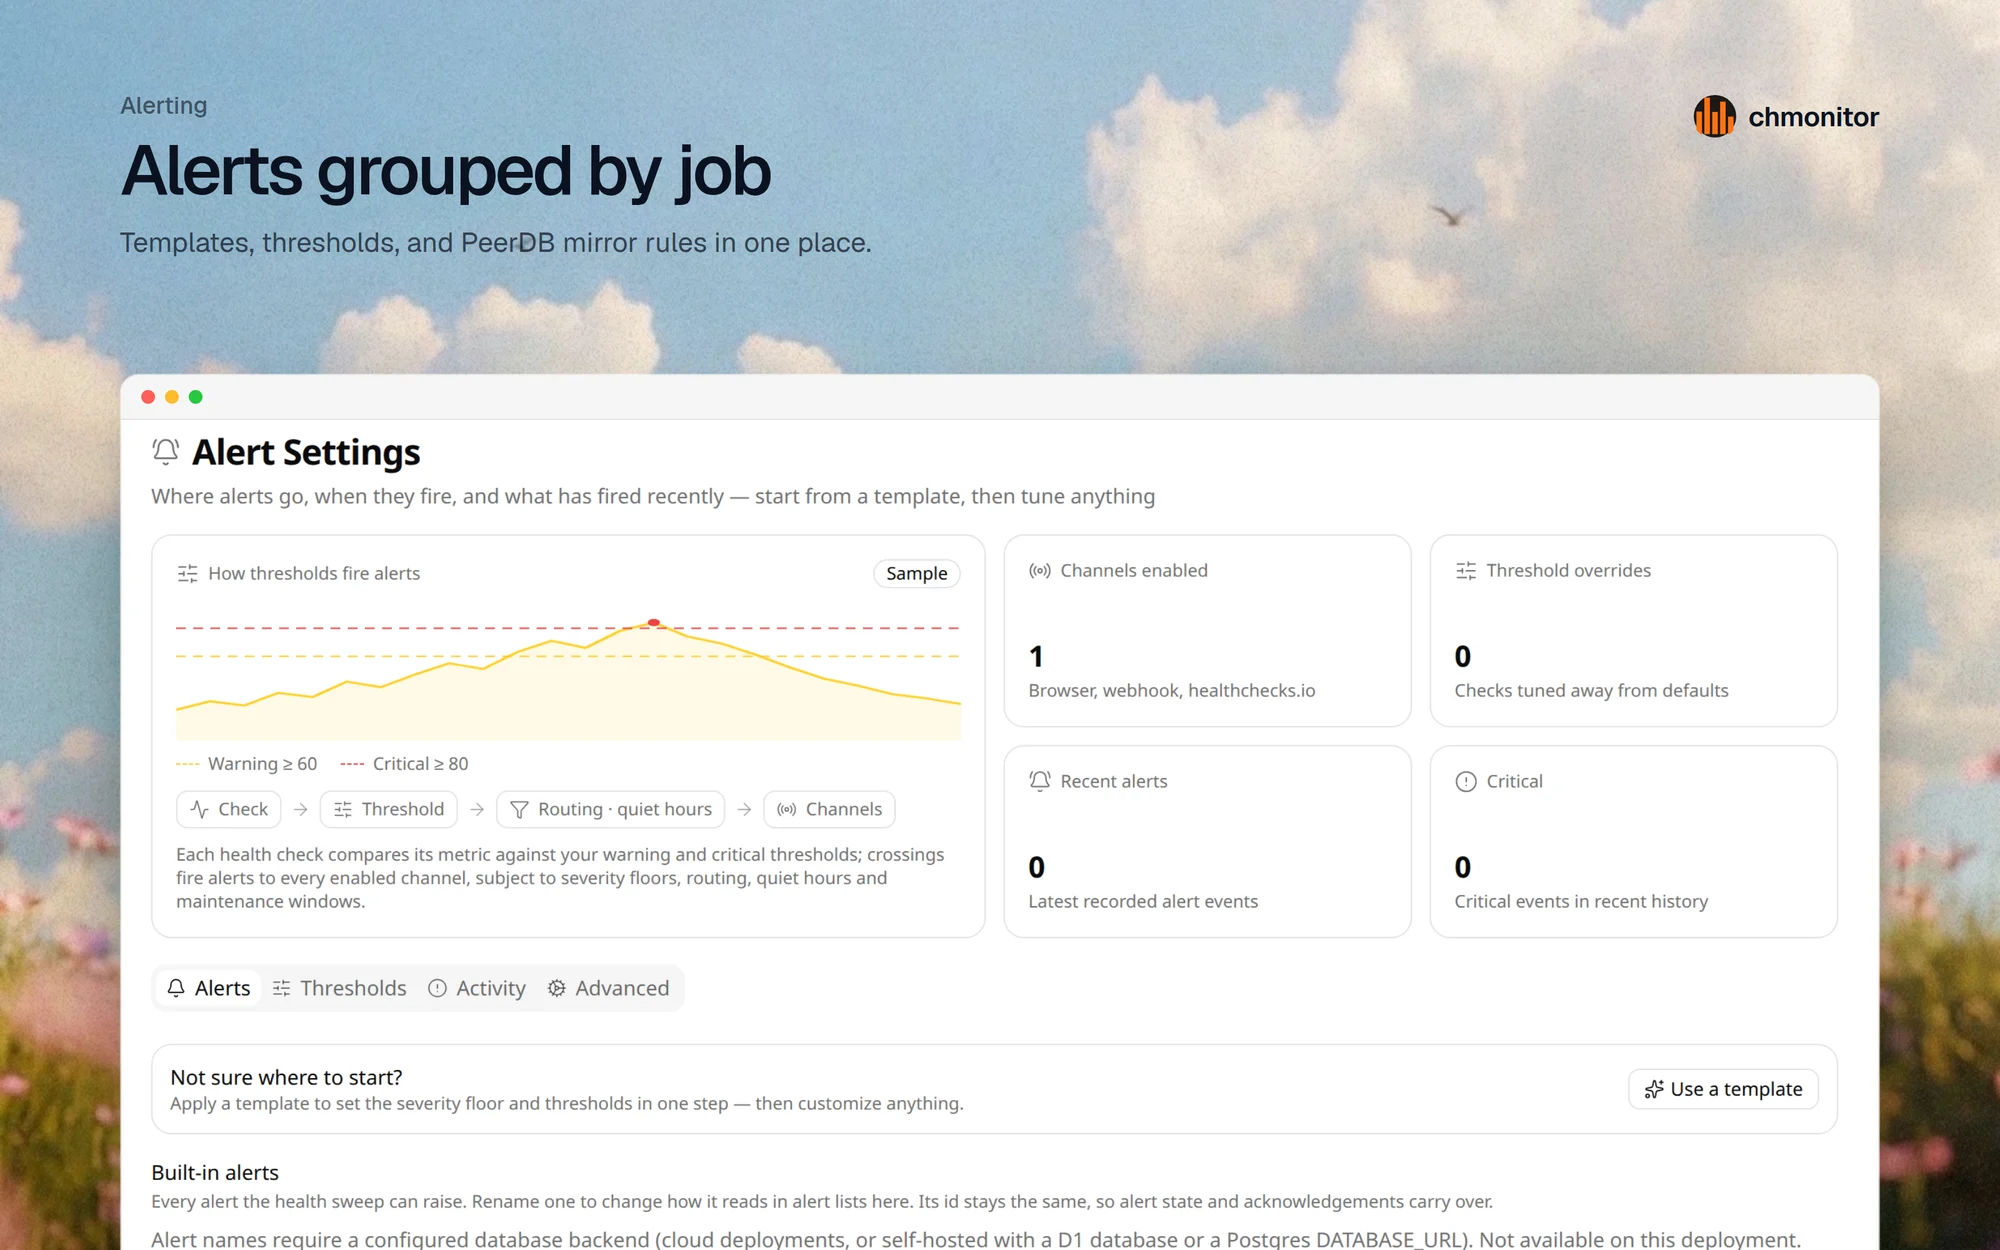
Self-hosters can declare alerts in alerts.yaml. Its thresholds apply to the health sweep and to current findings, merged through one source layer.
PeerDB alerting got much deeper:
- Editable alert rules with mirror match, thresholds, and mute.
- A warning when a running mirror has not finished a sync batch in 30 minutes, and when a running CDC mirror stops moving rows.
- An alert when the PeerDB API is unreachable or auth fails.
- One alert per error-log pattern instead of one per mirror. Logs can be grouped by mirror, table, or message pattern, and noisy patterns muted.
Insights also gained replication-queue and insert-backpressure checks, and broken detached parts are now reported on their own.
Easier navigation
The sidebar is regrouped into task groups, and the main groups have hub landing pages. Hover a group to see its pinned and recent pages. On touch screens, sidebar pages have a row actions menu, and controls that used to show only on hover now stay visible. Pages that are not available on your deployment are hidden by default.
More reliable
- Scans of
query_logandpart_logare bounded by time, and health and table scans are restricted to local database engines. - The dashboard and Explorer show friendly error text instead of raw ClickHouse messages. Agent connection errors become clear next steps.
- The API classifies ClickHouse errors by code, returns 400 for malformed JSON, rejects bad host ids and limit params, and enforces feature permissions on table routes.
- Dialogs fit small screens, and empty states are real empty states.
New docs
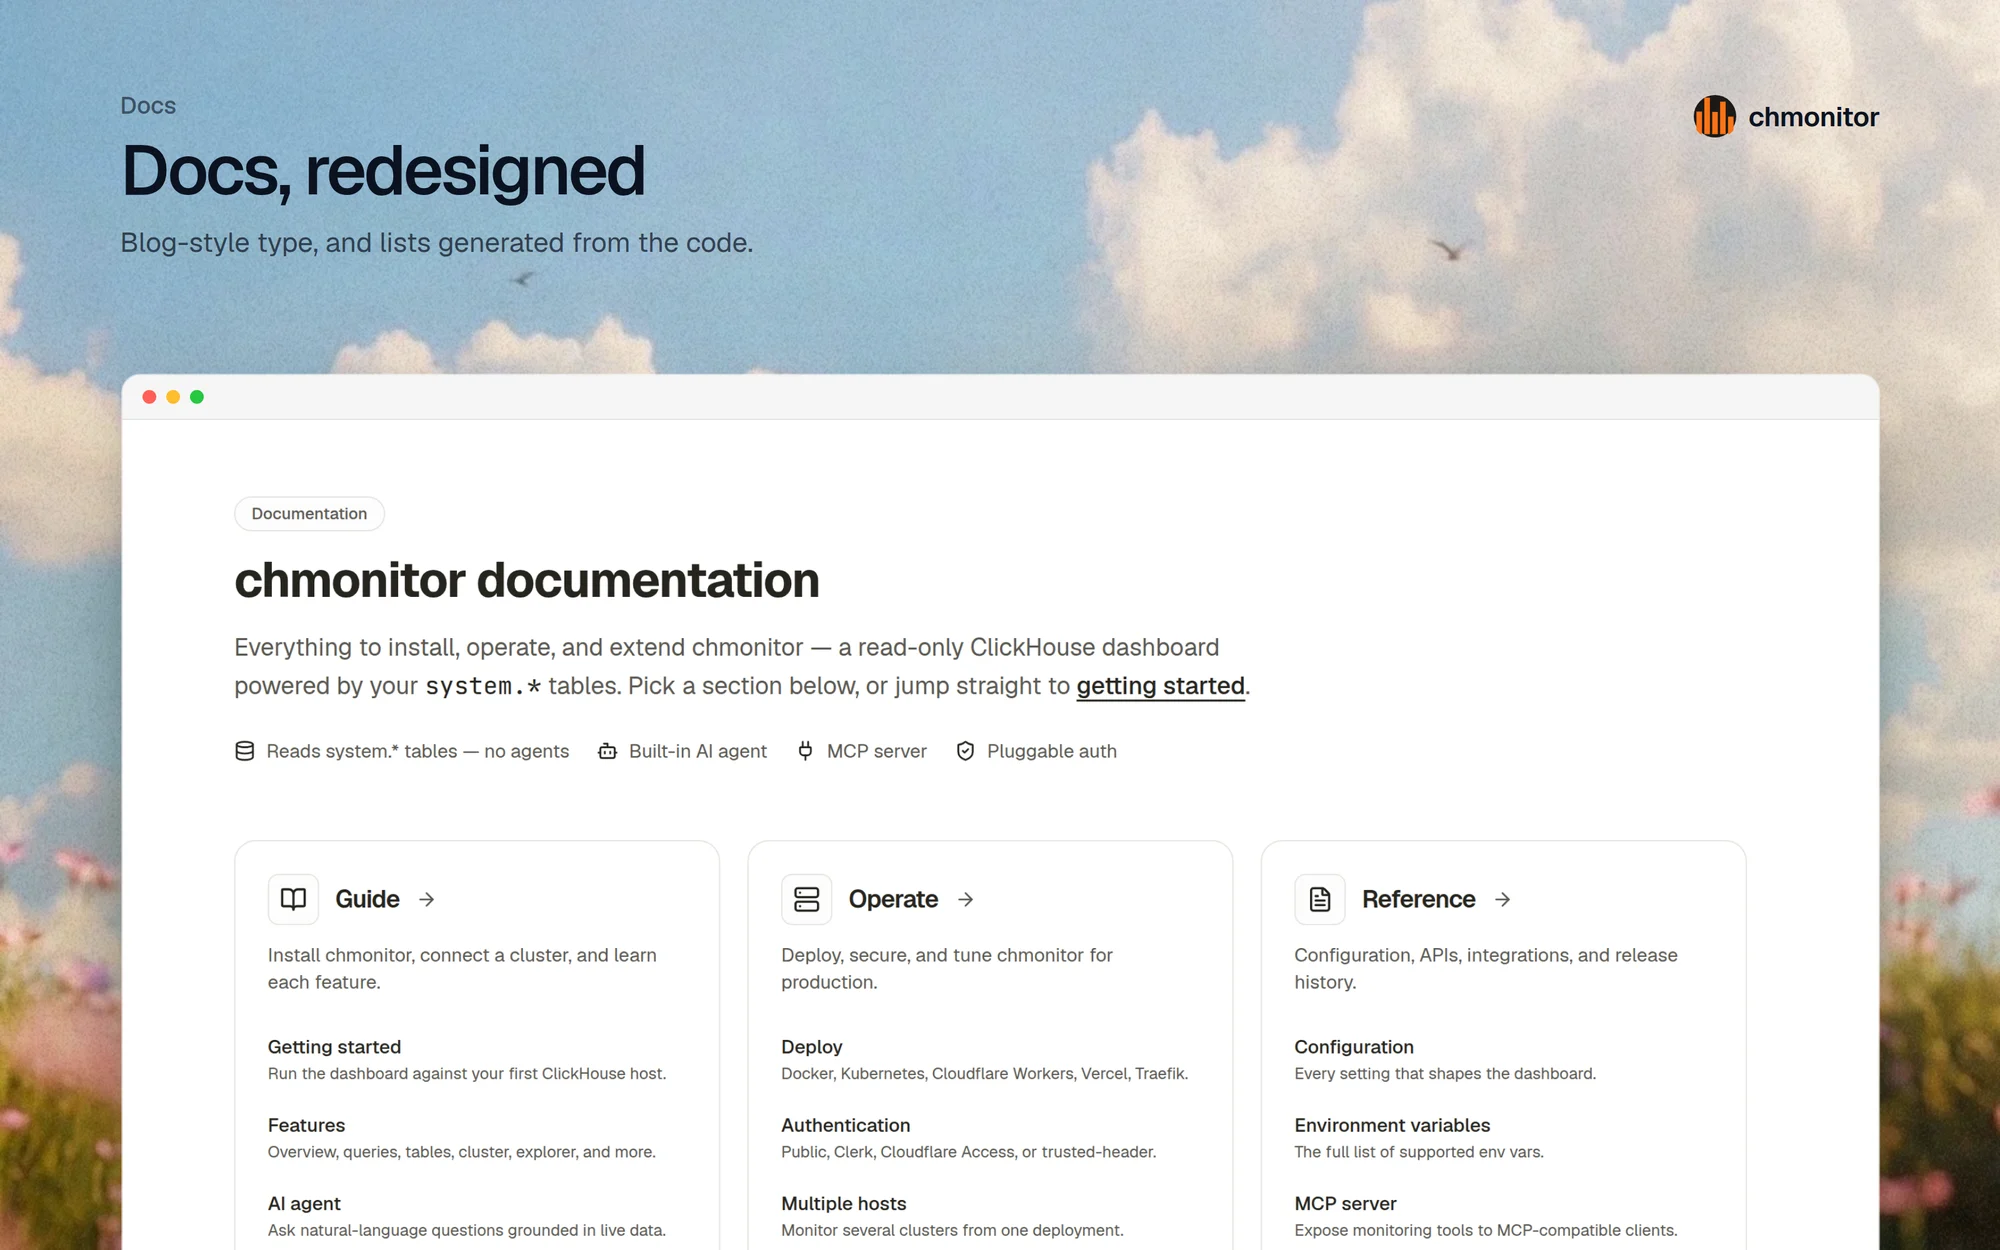
docs.chmonitor.dev has a blog-style theme and new typography. Rule, tool, env, and version lists are now generated from the code, with a test that catches drift.
Upgrading
Pull the new image or redeploy. Self-hosted agents now have control tools on by default; set AGENT_ENABLE_CONTROL_TOOLS=false if you do not want them.
docker pull ghcr.io/chmonitor/chmonitor:0.3.7Read more
- chmonitor v0.3.6 — everything since v0.2
- AI agent docs
- GitHub release v0.3.7