chmonitor v0.3 is the biggest release since the project started — a ground-up rebuild on TanStack Start. Everything is new: a faster dashboard, an AI agent that answers questions about your cluster, live query monitoring, a data explorer, cluster topology, AI insights, and self-hosting that’s a single command on Cloudflare Workers, Docker or Kubernetes.
Here’s the ~28-second launch film — every scene is the real product:
v0.3 lands 8 new features, more than 70 fixes, 13 performance wins, and 71 charts.
Everything that’s new
Highlights
A faster dashboard
The whole app moved to TanStack Start with a native Cloudflare Workers
bundle. Pages are prerendered as a static shell and hydrate with TanStack Query,
so the first paint is instant and data streams in progressively. Multi-host
routing stays as simple as ?host=0.
An AI agent that knows your cluster
The new agent connects over an MCP server and can read every system table. Ask “why is this query slow?” or “what changed in the last hour?” and it pulls the metrics, runs the diagnostic SQL, and explains what it found — no more memorising table names.
Health, audit and insights
Color-coded cluster health rolls up into a ready-made audit prompt, while AI Insights continuously scans for anomalies and regressions and ranks them by severity, so the important things float to the top.
Self-host anywhere
A v0.3 deploy is one command. Run it on Cloudflare Workers, Docker or Kubernetes — same codebase, same image, configured entirely through environment variables.
docker compose up -dWhat’s landed since launch
v0.3 keeps shipping. Since the initial release:
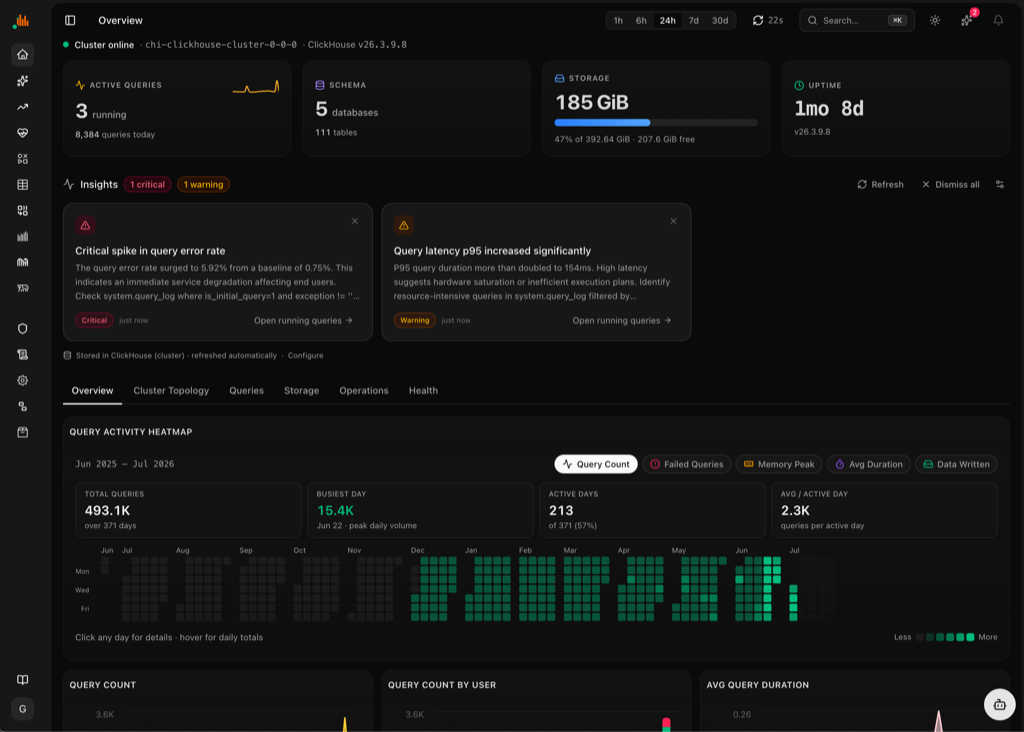
A year of query activity, at a glance. The Overview page now has a calendar heatmap of query volume, failures, memory and duration — the same glanceable pattern as a GitHub contribution graph.
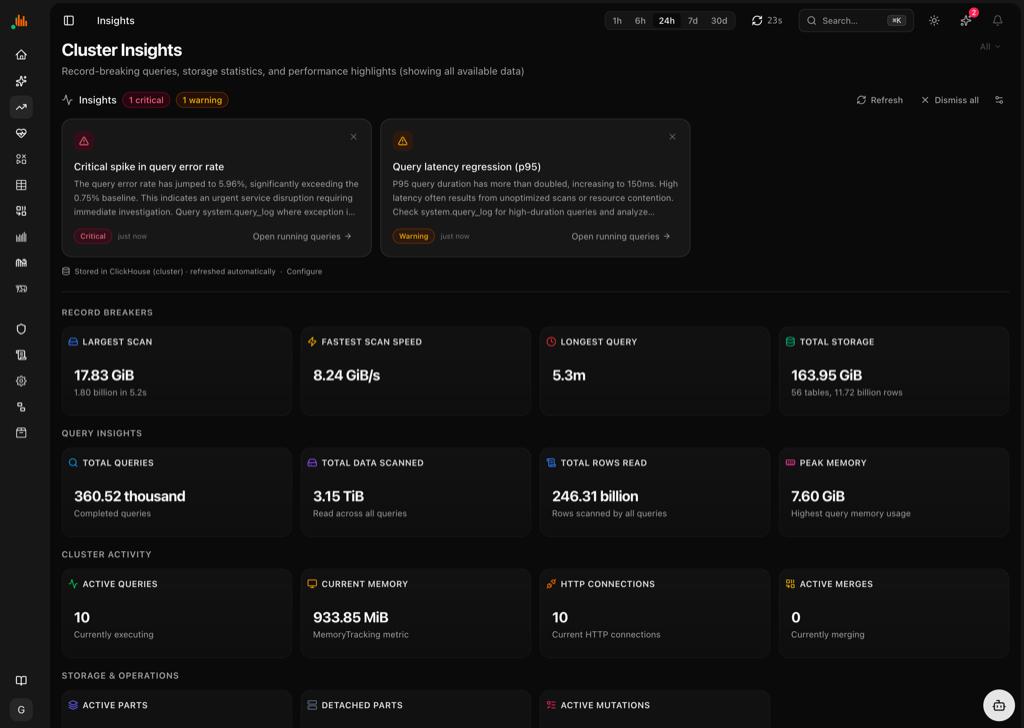
Cluster Insights, a new page: auto-detected findings (error-rate spikes, latency regressions) plus record breakers — largest scan, fastest scan speed, longest query, total storage — surfaced without building a single dashboard.
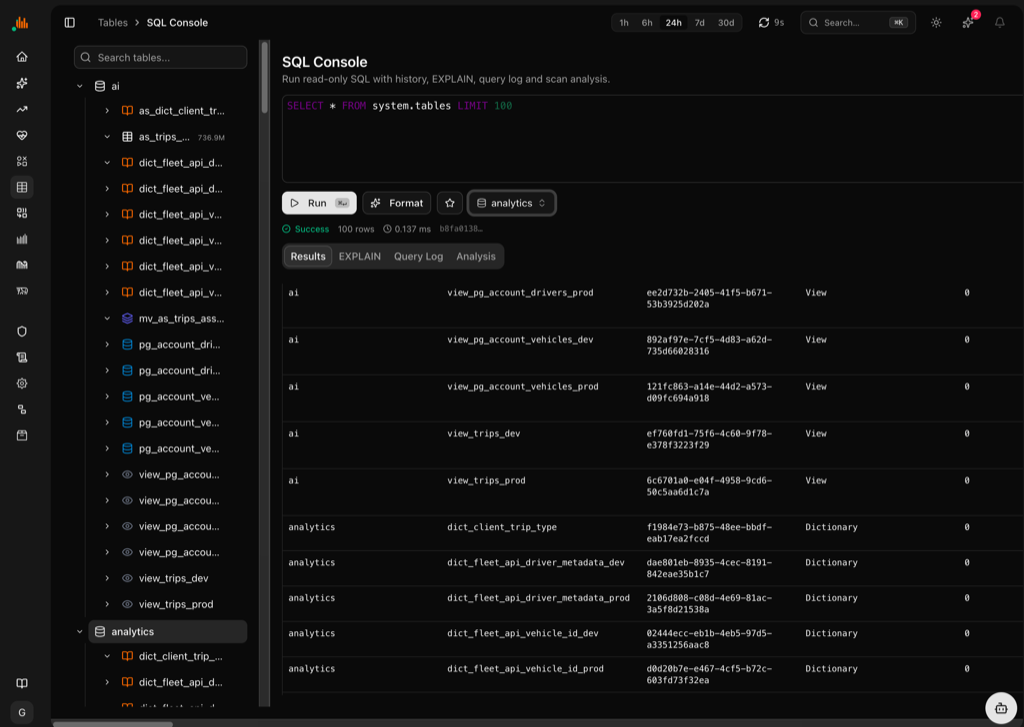
SQL Console: run read-only SQL with history, one-click EXPLAIN, query log and scan analysis, without leaving the dashboard for a separate client.
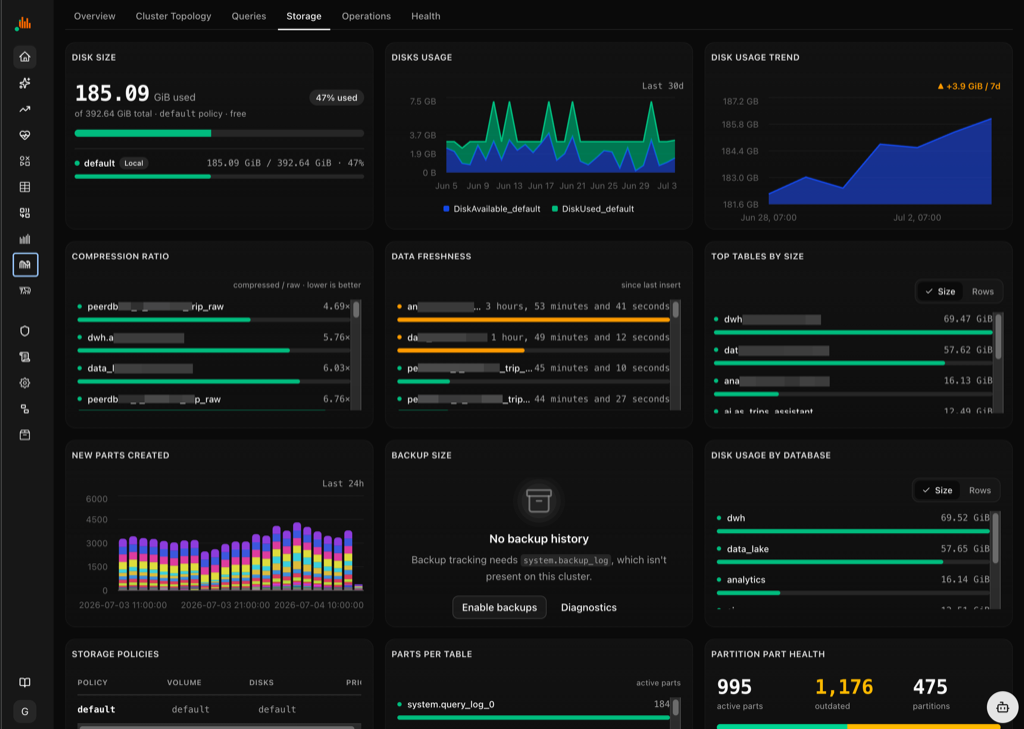
Storage breakdown by database, table and part, so you know exactly where the bytes go.
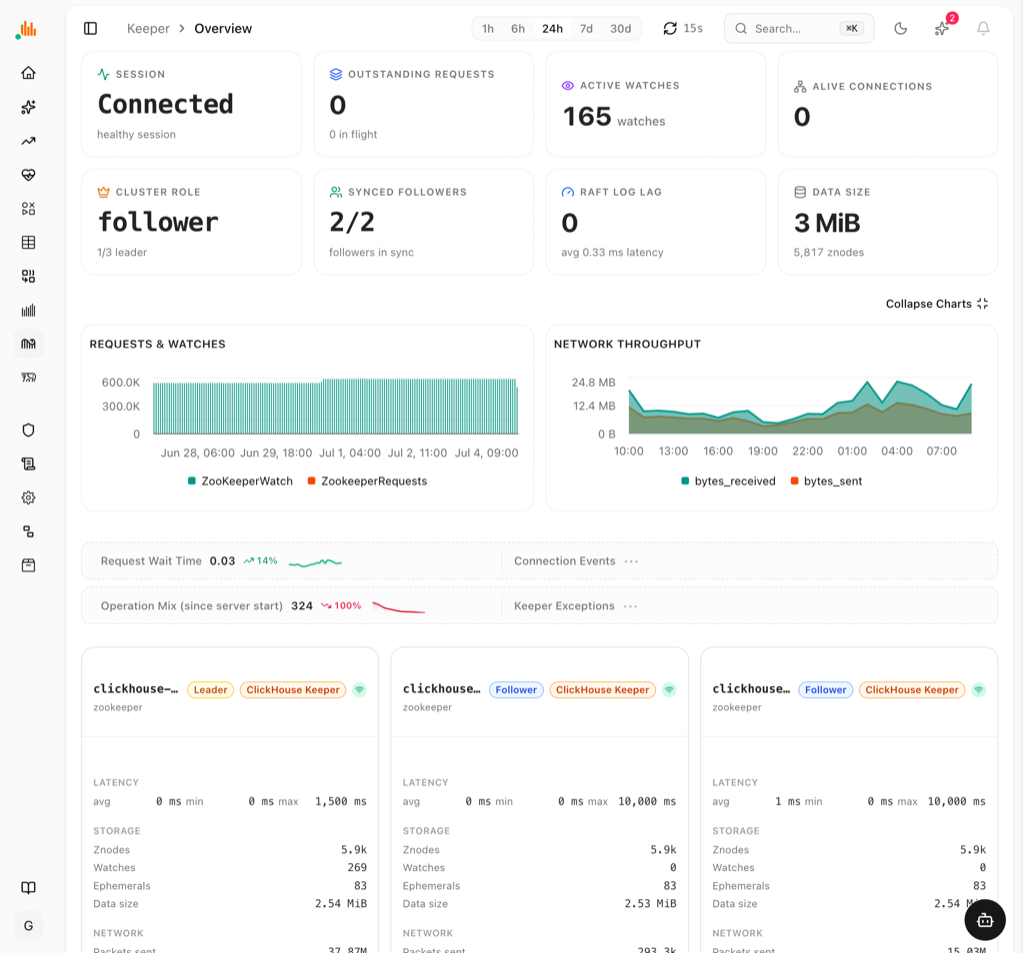
ClickHouse Keeper monitoring: session state, watches, quorum role and per-node Raft stats for every Keeper node.
Alerting also grew a custom alert rule builder (define your own thresholds and conditions, not just the built-in health checks) and an email adapter (Mailgun/SendGrid) alongside the existing Slack/Discord webhooks — see Alerting to Slack and Discord for the webhook walkthrough.
Changelog
| Area | What changed |
|---|---|
| Dashboard | Rebuilt on TanStack Start; static shell + TanStack Query; 15+ pages, 71 charts |
| AI agent | New agent over MCP; reads system tables; 29+ tool categories |
| Query monitoring | Live running + historical queries, cost ranking, EXPLAIN tree |
| Data explorer | Database browser, dependency graph, SQL console |
| Insights | AI insights engine — anomalies & regressions ranked by severity |
| Metrics | CPU / memory / IO + ClickHouse profiler events |
| Cluster | Topology diagram — nodes, shards, replicas, Keeper quorum |
| Health | Color-coded health → generated audit prompt |
| Deploy | One-command self-host on Cloudflare Workers / Docker / Kubernetes |
| Performance | 13 perf wins — pooling, memoization, cache limits, hidden-chart unmounting |
See the full commit-level history in the GitHub releases.
Try it now: open the live dashboard, read the docs, or star us on GitHub.