
chmonitor started as a ClickHouse dashboard. Today it monitors Postgres too — same dashboard, same read-only guarantees, no agent to install on the database side. It’s in beta: off by default, free on every plan while it stabilizes.
What you get
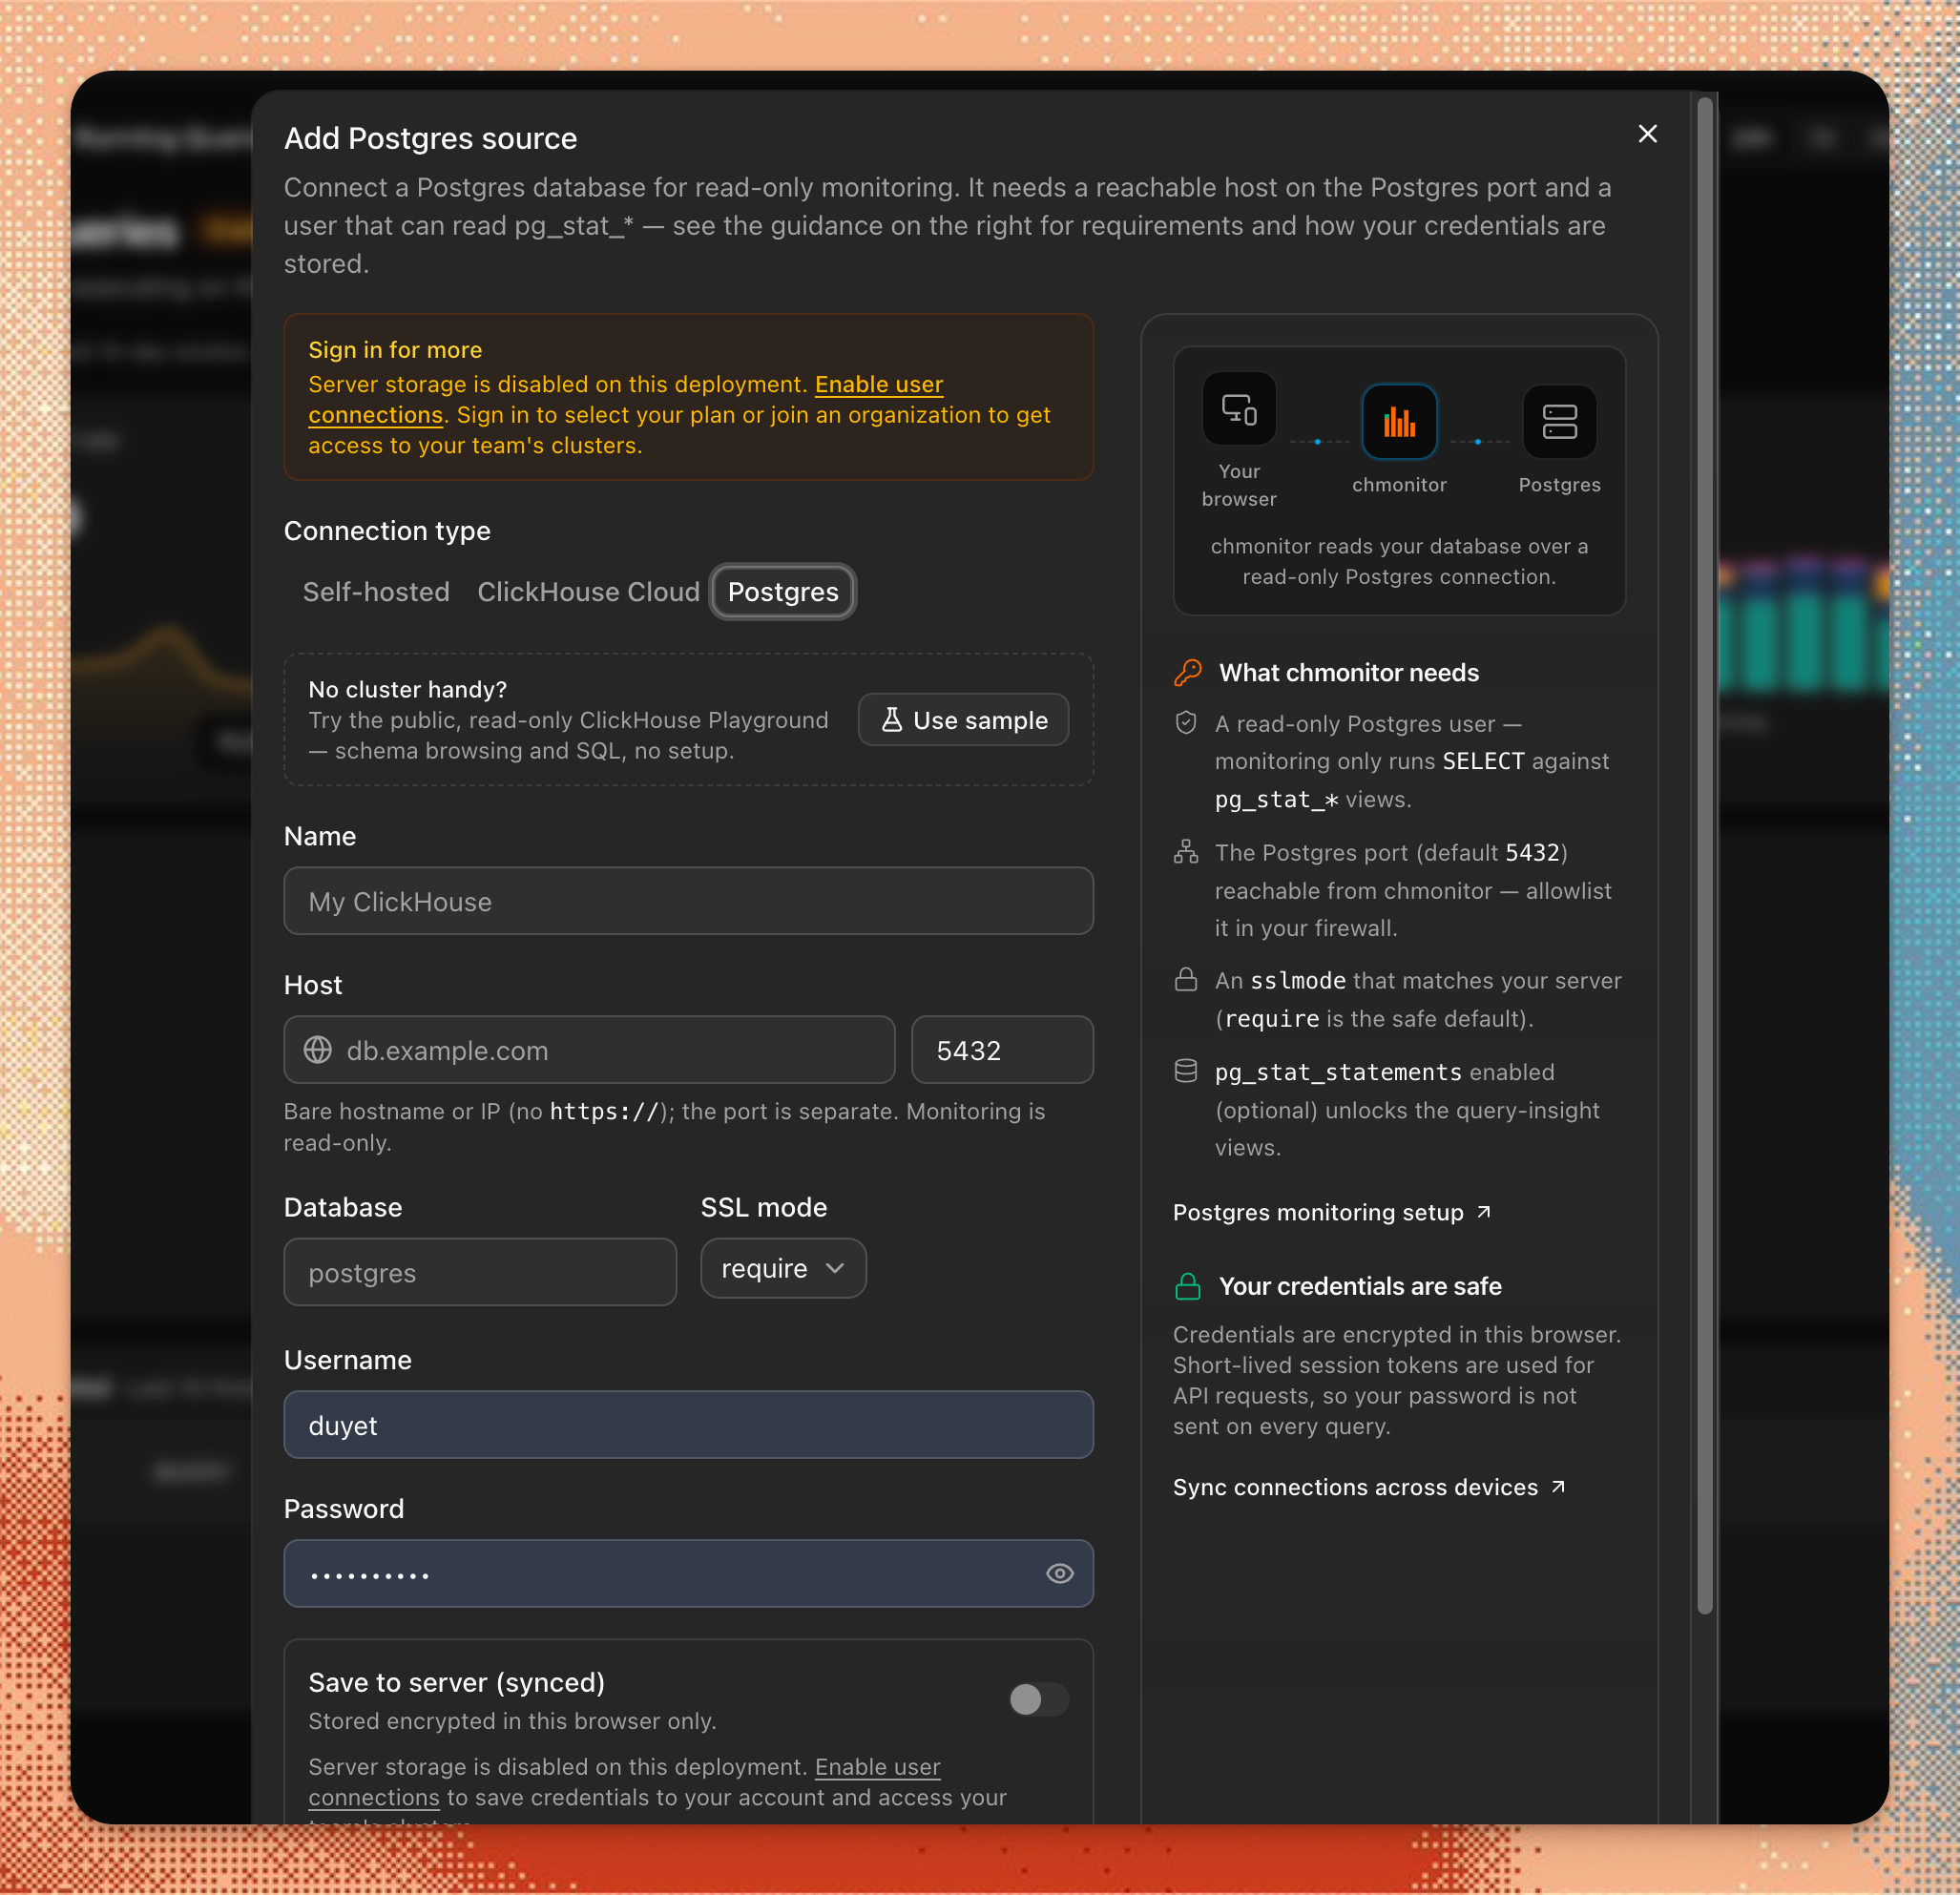
Why Postgres, and why now
A lot of chmonitor users run Postgres somewhere next to ClickHouse — as the system of record feeding a CDC pipeline, or just as another database the same team owns. Asking them to open a second tool for it never made sense. Postgres support adds a source engine dimension alongside ClickHouse and ClickHouse Cloud, so the dashboard, the menu, and the AI agent all understand “this host speaks Postgres” the same way they already understand “this host is a ClickHouse Cloud cluster.”
Read-only, the same way ClickHouse is
Every Postgres query runs through one path: it connects per request, pins
default_transaction_read_only=on, and only allows a single
SELECT/WITH/SHOW/EXPLAIN/TABLE/VALUES statement. There’s no second
access path and no write capability anywhere in the feature. Connecting to a
user-supplied host also goes through an SSRF guard before chmonitor ever opens
a socket.
We recommend pointing the connection at a dedicated read-only Postgres role — belt and suspenders on top of the query-level guard.
Query Insights needs pg_stat_statements
Running Queries works out of the box against pg_stat_activity, which every
Postgres has. Query Insights needs the pg_stat_statements extension. If it’s
not installed, the page shows the exact two steps instead of an error:
-- postgresql.conf, then restart Postgres
shared_preload_libraries = 'pg_stat_statements'
CREATE EXTENSION pg_stat_statements;Ask the agent
Three new tools join the agent’s existing set: run_postgres_select_query,
get_postgres_metrics, and list_postgres_slow_query_patterns. Point them at
a Postgres host and ask the same kind of questions you’d ask about ClickHouse —
what’s slow, what’s the cache hit ratio, what’s currently running.
If you’re moving data from Postgres into ClickHouse, the agent’s migration-planning skill now covers that path too, with PeerDB as the recommended CDC route. Already running a CDC pipeline? See Monitoring PeerDB for snapshot progress, batch history, lag triage, and replication-slot health.
Try it
Set CHM_FEATURE_POSTGRES_SOURCE=true, add a POSTGRES_HOST (or connect one
from the dashboard UI), and open /postgres/queries. Full setup, environment
variables, and beta limitations are in the
Postgres docs.
This is a beta: expect rough edges, and treat it as ready for evaluation, not yet for every production cluster. Feedback is welcome — open an issue on GitHub or try it on the live dashboard.