
chmonitor added Postgres as a monitored source — this post is the how-to: the exact steps to get a Postgres database showing up in the dashboard, safely, with the least-privilege user you should actually use in production.
Prerequisites
- A Postgres database you can create a role on (any recent version works — chmonitor only reads from
pg_stat_activityand, optionally,pg_stat_statements). chmonitorrunning self-hosted, or access todash.chmonitor.dev(Cloud).- Superuser (or equivalent) access once, to create the monitoring role and the extension.
Steps
1. Turn on the feature flag
Postgres support is off by default. Set:
CHM_FEATURE_POSTGRES_SOURCE=trueNothing else changes until this is set — no new menu items, no new agent tools, no new connections accepted.
2. Create a read-only monitoring role
Don’t point chmonitor at an application or admin user. Create a dedicated role scoped to what monitoring actually needs — pg_monitor for stats visibility, plus explicit SELECT on the stats views:
CREATE ROLE chmonitor_ro WITH LOGIN PASSWORD 'change-me';
GRANT pg_monitor TO chmonitor_ro;
GRANT SELECT ON pg_stat_activity TO chmonitor_ro;
GRANT SELECT ON pg_stat_statements TO chmonitor_ro;
pg_monitor is a built-in Postgres role (since 10) that bundles pg_read_all_stats, pg_read_all_settings, and pg_stat_scan_tables — enough to see connection state, wait events, and database-level stats without granting access to table data. The explicit SELECT grants above are belt-and-suspenders for the two views chmonitor actually queries.
This is defense in depth, not the only guard: every Postgres query chmonitor issues goes through one path (queryPostgres()) that pins default_transaction_read_only=on and allows only a single SELECT/WITH/SHOW/EXPLAIN/TABLE/VALUES statement per request. There’s no write path anywhere in the feature — but a role that can’t write in the first place means one less thing to reason about.
3. Enable pg_stat_statements
Running Queries works against pg_stat_activity, which every Postgres has out of the box. Query Insights needs the pg_stat_statements extension, which requires a restart to load:
-- postgresql.conf (or ALTER SYSTEM), then restart Postgres
shared_preload_libraries = 'pg_stat_statements'
CREATE EXTENSION pg_stat_statements;If you skip this step, Query Insights doesn’t error — it shows an empty state with these exact two commands so you can copy-paste and come back.
4. Connect the host
Two ways in, mirroring how ClickHouse hosts work today.
Environment variables (comma-separated for multiple hosts, same pattern as CLICKHOUSE_HOST):
POSTGRES_HOST=db.example.com
POSTGRES_PORT=5432
POSTGRES_USER=chmonitor_ro
POSTGRES_PASSWORD=change-me
POSTGRES_DATABASE=postgres
POSTGRES_SSLMODE=require
POSTGRES_NAME=Production Postgres
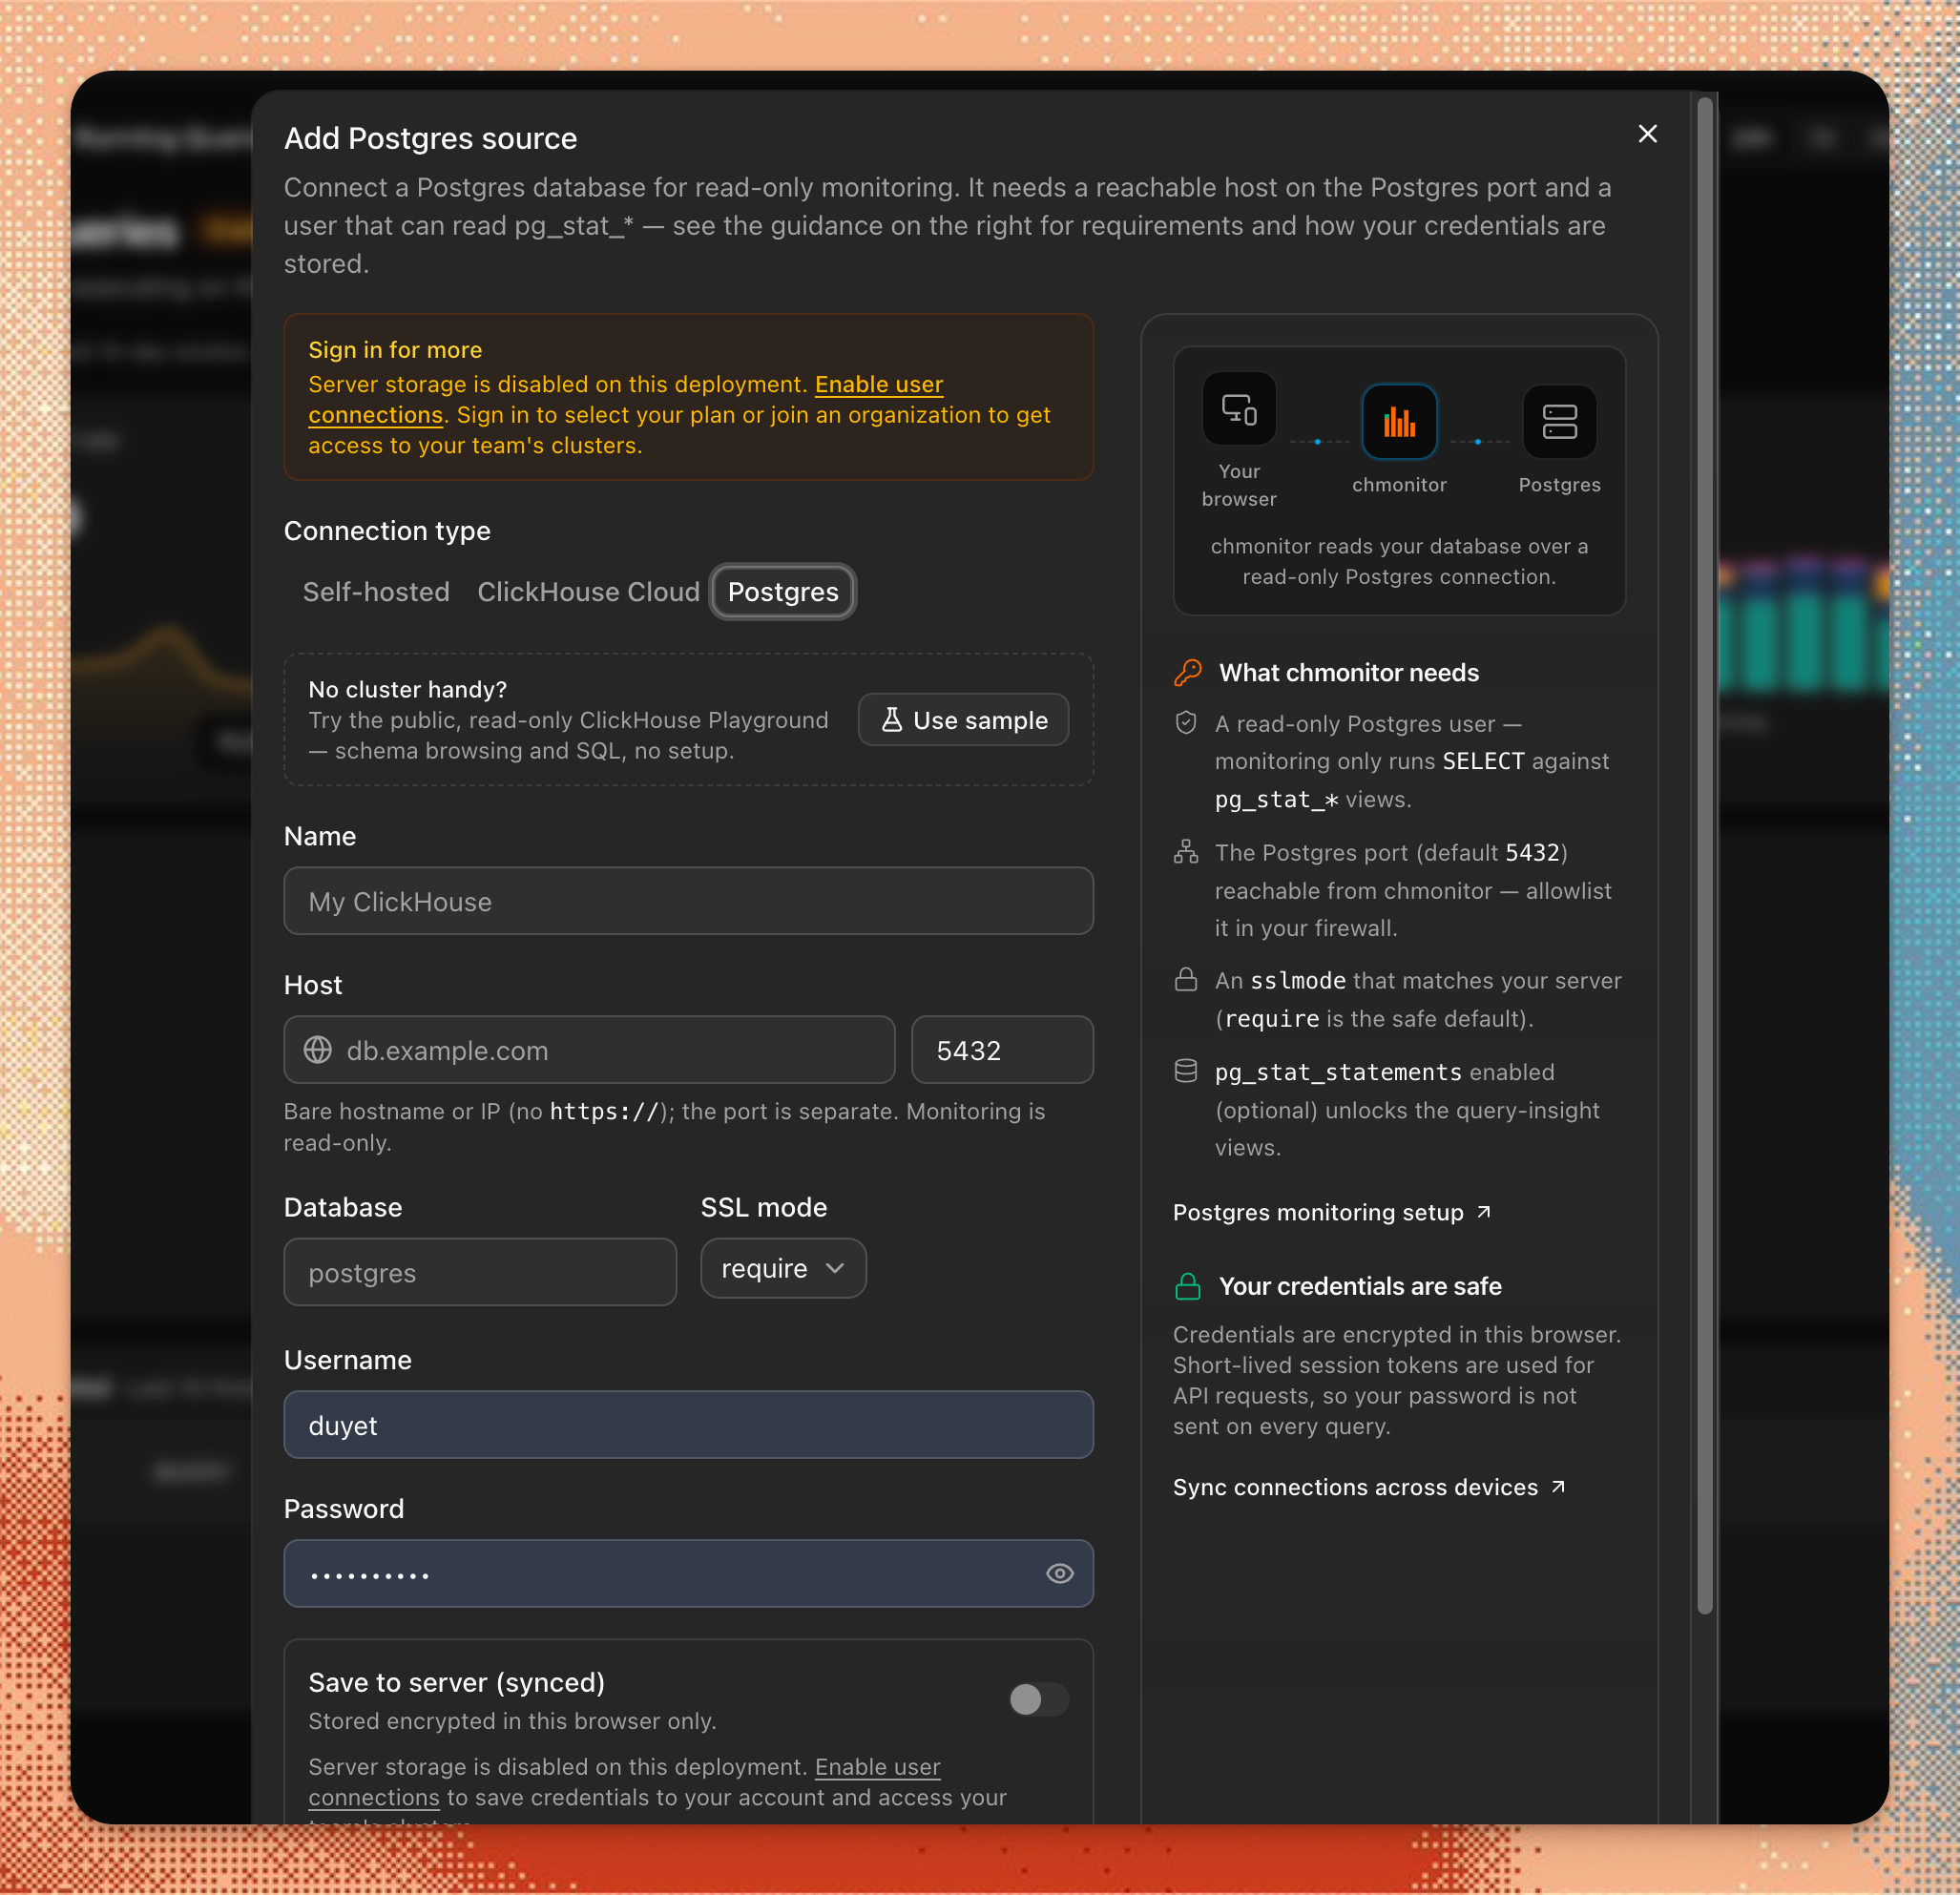
Dashboard UI (per-user connections, when enabled): open the connection form, pick the Postgres tab, and fill in host, port, database, user, password, and SSL mode. Credentials are encrypted at rest, the same as ClickHouse per-user connections.
Database behind a firewall? If you’re on Cloud and Postgres isn’t publicly reachable, don’t try to allowlist an IP — Cloudflare Workers egress from a shared, rotating pool. Use a Cloudflare Tunnel instead; it works for Postgres the same way it does for ClickHouse. Self-hosted deployments skip this entirely since chmonitor already runs inside your network.
Once the connection succeeds, switch to it from the host switcher (or ?pg=<connectionId> in the URL) — the sidebar swaps to the two Postgres pages automatically.
5. Read Query Insights
/postgres/queries lists the slowest normalized query patterns from pg_stat_statements, ranked by total execution time, refreshed every 30 seconds. “Normalized” means literals are stripped — WHERE id = 42 and WHERE id = 108 collapse into one row, so you’re looking at query shapes, not one-off executions. Click a row for the detail flyout.
This is where you find the query pattern that’s quietly responsible for most of your total database time, even if no single execution of it looks slow in isolation.
6. Watch Running Queries
/postgres/activity is live pg_stat_activity — state, wait event, query text, duration — refreshed every 5 seconds. This is the page for “what’s running right now”: a backend stuck on a lock, a long-running migration, a connection pool that’s not draining.
Unlike Query Insights, this needs no extension — pg_stat_activity is always available, so this page works the moment the connection is up, even before you’ve enabled pg_stat_statements.
7. Ask the AI agent
If you use chmonitor’s AI agent, it gets three Postgres-aware tools once the feature flag is on:
run_postgres_select_query— a read-onlySELECT/WITH/SHOW/EXPLAIN/TABLE/VALUESagainst the source.get_postgres_metrics— version, uptime, connection counts by state, cache hit ratio, commit/rollback/deadlock counts, database size, replication status.list_postgres_slow_query_patterns— the same slow-pattern data as Query Insights, but as a tool call; returns a helpful message instead of an error ifpg_stat_statementsisn’t installed.
Ask it the same kind of thing you’d ask about a ClickHouse host: “what’s the cache hit ratio on production Postgres” or “what’s currently running longer than a minute.” One caveat right now: the agent tools resolve hosts from POSTGRES_HOST env vars, not per-user connections added through the dashboard UI — the same limitation ClickHouse agent tools have today.
What you should have now
- A
chmonitor_rorole withpg_monitorand explicitSELECTon the two stats views — nothing else. pg_stat_statementsloaded and enabled (optional but recommended).- A connected Postgres host showing Query Insights and Running Queries in the sidebar.
If you’re moving data from Postgres into ClickHouse via CDC, that’s a separate concern from monitoring Postgres itself — see Monitoring PeerDB for snapshot progress, batch history, and replication-slot health once a pipeline is running.
This feature is in beta — free on every plan while it stabilizes. Full reference for every environment variable and current limitations lives in the Postgres docs.