
Most monitoring tells you what you asked about. AI Insights tells you what you didn’t think to ask: chmonitor periodically inspects your cluster’s system tables, turns anomalies into short, severity-ranked findings, and puts them where you’ll actually see them.
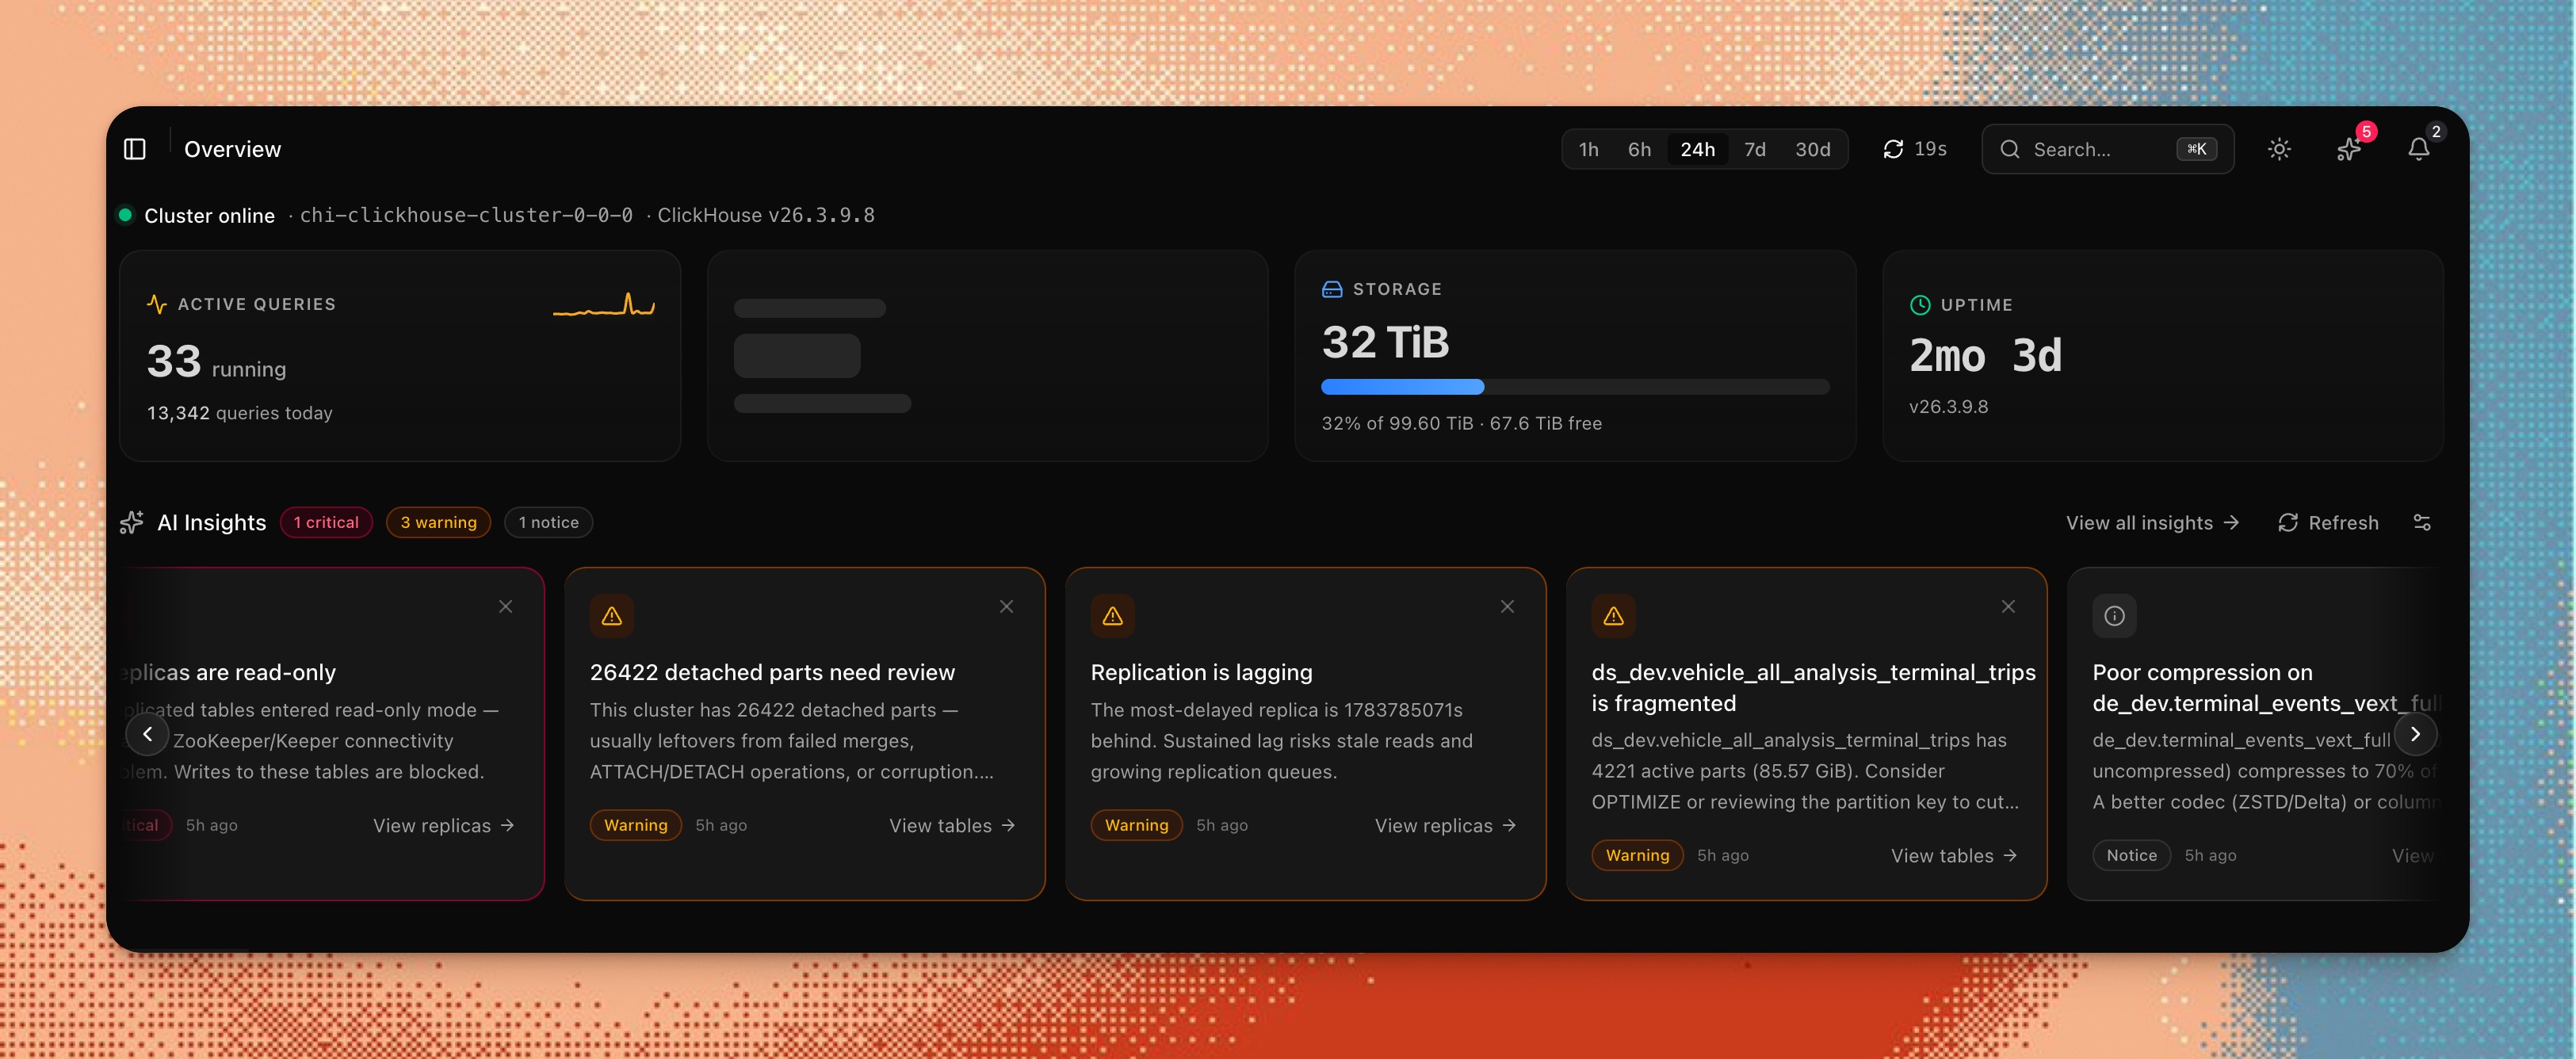
Findings, not dashboards
Each finding is a concrete observation with a severity and a next step — “2 replicas are read-only”, “26,422 detached parts need review”, “replication is lagging”, “this table’s compression codec is underperforming” — linked straight to the page where you’d act on it (replicas, tables, merges).
Findings have stable keys: dismiss one and it stays dismissed until the underlying condition actually changes, so the strip doesn’t nag you about the thing you already triaged.
In the header, on every page
You don’t have to be on the overview to catch a new critical finding. The AI Insights panel in the header shows the badge count and the latest findings from any page of the dashboard:
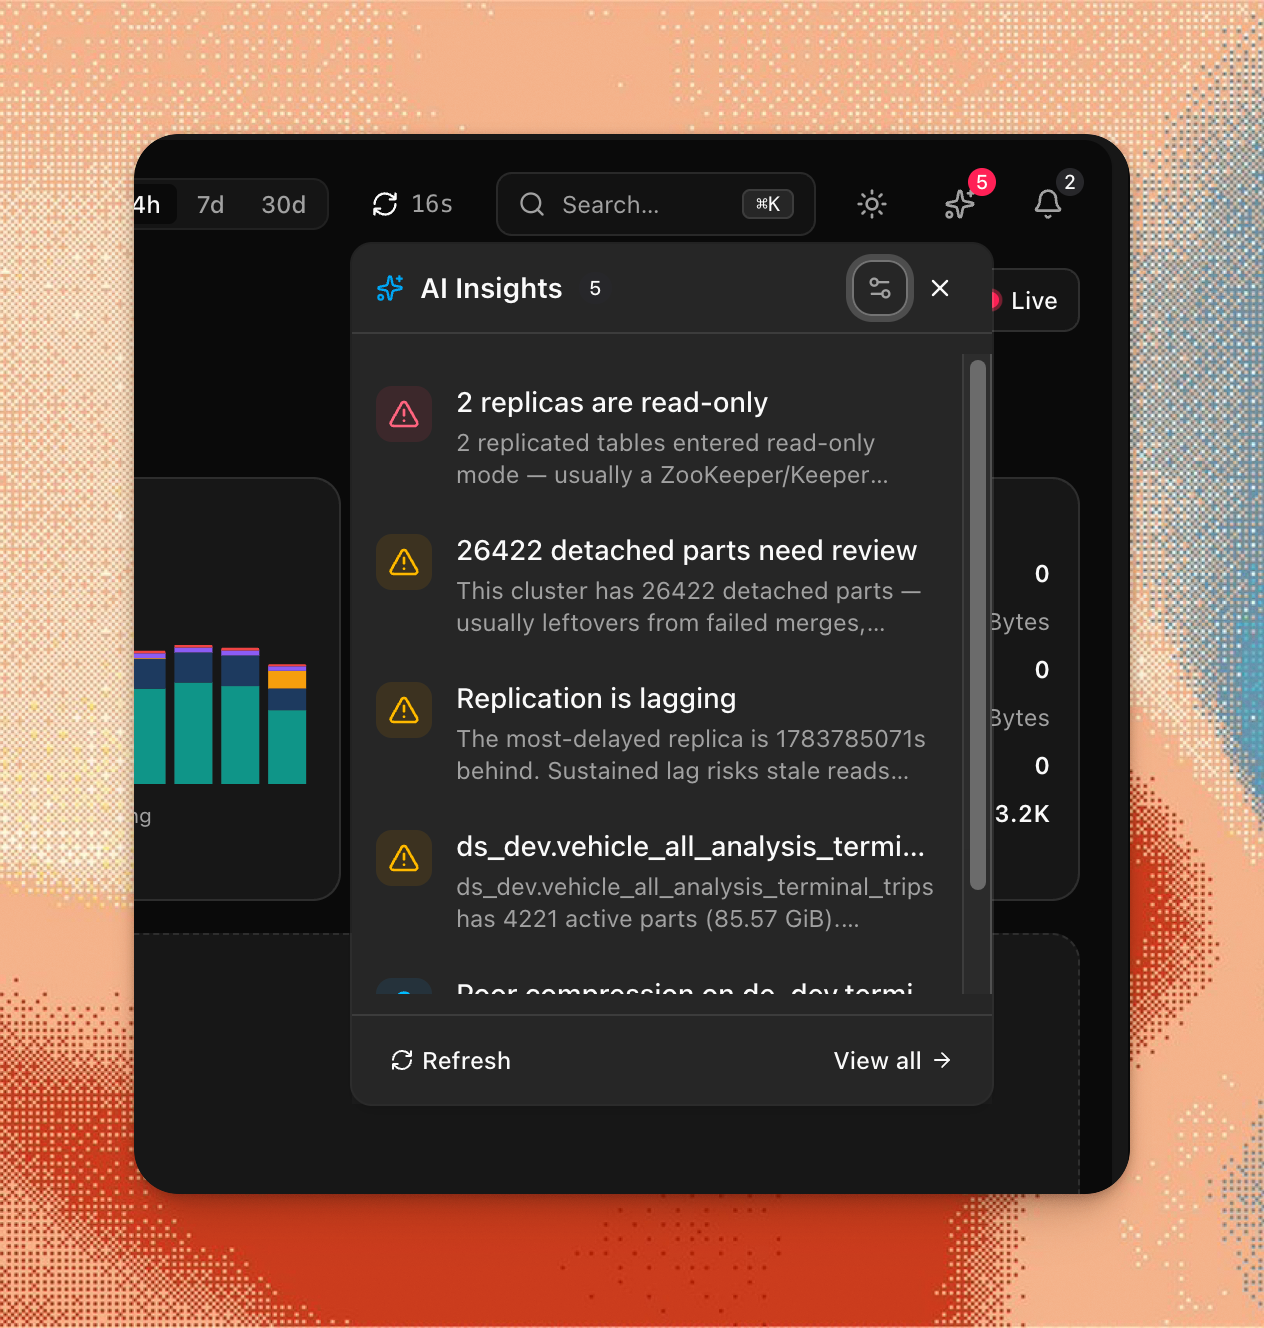
Insights are generated on a schedule (cron) and on demand — hit Refresh in the panel to re-inspect right now.
Where it runs
AI Insights works on chmonitor Cloud and self-hosted alike. Findings persist through a pluggable store (ClickHouse by default; D1, Postgres, or AgentState via one env var) — see the AI agent docs for configuration.
Related: Cluster insights and record breakers in v0.3, and the AI agent that powers ad-hoc questions.